You reproduce an intermittent failure, change one line, and restart the application. This time the request works. Now you need the old trace to work out why.
If it disappeared with the restart, you’re left comparing the new run with whatever you remember. Aspire 13.6’s dashboard keeps completed runs, so you can go back to the failed request instead.1
Aspire Field Notes starts with that problem: keeping a failure around long enough to investigate it after the app has moved on.
Healthy resources, failed request#
A failed business request doesn’t have to show up in /health. When a downstream dependency rejects a call, the request fails while the service keeps running and its health endpoint stays green.
GET /api/catalog fails with a 503 from inventory.Green indicators tell you the processes are running and passing their health checks. To diagnose the failed request, you need its downstream calls, durations, and errors.
So before changing code, make sure the application emits that telemetry. The dashboard can receive OpenTelemetry, but it can’t invent spans the app never produced. For .NET, Service Defaults is a good start. Node, Java, Python, and Rust services need their own instrumentation.
Choose the right kind of persistence#
Aspire 13.6 uses SQLite for dashboard storage. Its three modes have different purposes:2
| Mode | Storage behavior | When I would use it |
|---|---|---|
None | A temporary database for one dashboard process | A disposable standalone diagnostic session |
Run | A separate database for each dashboard run, with a run selector | Comparing a failing run with a later attempt |
Resume | One database reused across restarts, without separate run history | Continuing a standalone dashboard session |
When the AppHost launches the dashboard, it uses Run by default. You don’t need to add a database resource to get this behavior.
A standalone dashboard still defaults to None. To pick up where it left off after a restart, start it with aspire dashboard run --persistence Resume and a stable --application-name. Keep the name, data directory, and mode the same each time. Resume keeps adding to one database, so it won’t give you separate runs to compare. Only one dashboard process can write to it at a time.
Capture a baseline, a failure, and a recovery#
The companion catalog app is small. A Vite frontend named web calls a catalog API named api. The API reads PostgreSQL’s catalogdb, then makes one instrumented HTTP call to a separate inventory service, with no retry to hide a failure.
A development-only switch, Inventory__FaultEnabled, makes inventory return a 503 while its health endpoint stays green. Flipping it gives you a failure and a recovery to compare without breaking anything shared. Here you already know the cause. With a real bug, the trace has to support whatever fix you propose.
If you’re following along, walkthrough 01 has the commands and links to the one-time setup, including the database secret. The sample targets Aspire 13.6.1 and requires Aspire CLI 13.6 or later.
A request you can repeat#
Use the same request for each run. The companion’s AppHost adds a Load catalog command to web that sends one GET /api/catalog through the frontend, the same path the browser takes. It reports the HTTP status, trace ID, and response. You can use the highlighted button in the dashboard or run aspire resource web load-catalog from a terminal. Here’s the abridged registration:
web.WithHttpCommand(
    path: "/api/catalog",
    displayName: "Load catalog",
    endpointName: "http",
    commandName: "load-catalog",
    commandOptions: new HttpCommandOptions
    {
        Method = HttpMethod.Get,
        IsHighlighted = true,
        // PrepareRequest sets a ten-second timeout.
        // GetCommandResult returns the status, trace ID, and response as JSON.
    });
The full registration also reports a non-success status as a failed command, so a broken request never looks like a passing one.
With the fault off, Load catalog returns a 200 and three products. That’s your baseline.
Reproduce the failure#
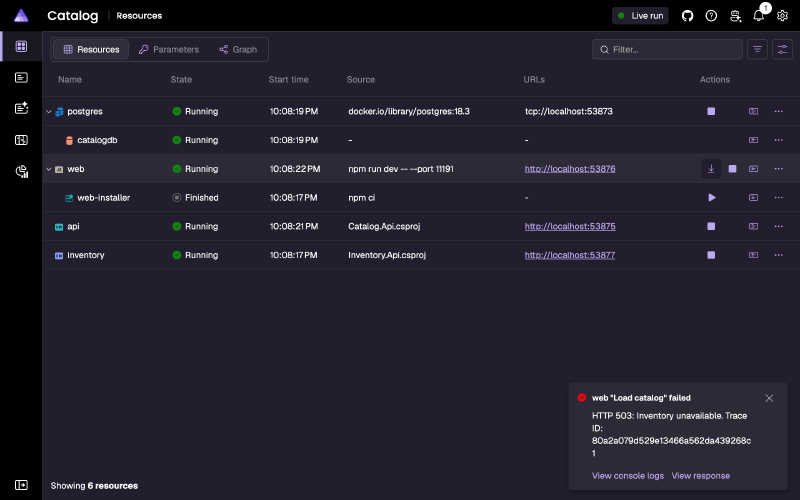
Restart the same app with the fault on and run Load catalog again. The frontend, API, inventory service, and database remain healthy, but the command fails with HTTP 503: Inventory unavailable and a trace ID:
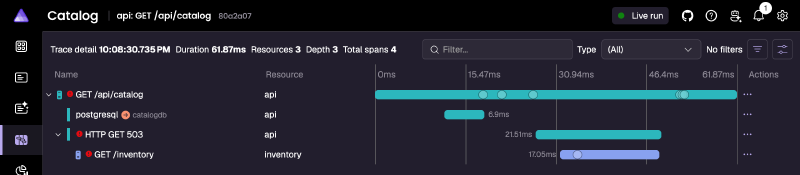
Open that trace. It has four spans: the API’s request, its PostgreSQL query, one HTTP call to inventory, and inventory’s own span. All three HTTP spans show 503, and there’s only one client span, so nothing retried the call:
Before stopping the failing run, open the dashboard’s Console logs page for both api and inventory. The dashboard stores a console stream in a run’s history only after you view or export it there. Reading the same output in a terminal with aspire logs doesn’t count. Structured logs sent through OpenTelemetry are stored either way.2
That’s easy to miss when a startup message is the clue you need.
CLI queries such as aspire otel traces --has-error read the live run. Picking a historical run in the browser doesn’t change what the CLI sees, so do the comparison below in the dashboard.
Keep the failure and compare recovery#
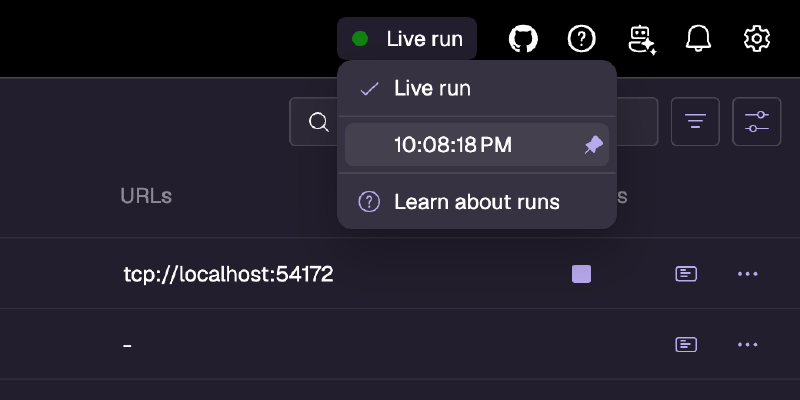
Open the run selector in the dashboard header. Hover or focus the Live run row to reveal Pin run, then pin the failing run. Stop the app, turn the fault off, start it again, and run Load catalog. The request returns a 200 and three products through the same call path.
- Run 1 is the baseline: Load catalog returns 200.
- Restart with the fault on. Run 2 returns 503, and Run 1 moves to earlier runs.
- Pin Run 2 and open its
apiandinventoryconsole logs. - Restart with the fault off. Run 3 returns 200, and the pinned run stays.
- Select Run 2 to compare its trace and logs with the recovery.
In the new dashboard, the run selector lists the pinned failing run beside the live one:
Select the pinned run. Its failed trace and the api and inventory Console logs you viewed earlier are still there:

History is on by default. Pinning only protects a run from being pruned.
Change one thing between runs. If you update packages, request data, storage, and the fault setting at once, you won’t know which change mattered.
Go into the comparison with a question:
| Question | What to compare |
|---|---|
| Did the request succeed? | Status code and response body the caller received |
| Did the failure move elsewhere? | Errors and span relationships across the request |
| Did a retry hide the problem? | Downstream attempts and elapsed time, where instrumented |
| Did the environment change? | Resource properties, endpoints, and configuration relevant to the failure |
Be careful with duration alone. Warm caches and connection pools can make a second request faster even if the fix changed nothing.
How much history the dashboard keeps#
By default, the dashboard keeps up to 10 unpinned runs per application and prunes the oldest when a new run starts. Pinned runs don’t count toward that limit.2
The dashboard groups runs by application name, so two clones of the same AppHost share one history and the same 10-run limit. A burst of runs in one checkout can prune an unpinned reproduction from the other.
Each run’s database also caps console logs, structured logs, and traces at 100,000 each by default, shared across resources. Metric points have their own limit. If a run exceeds those caps, its oldest data is gone, pinned or not.
Those caps count records, so large attributes and high-cardinality metrics can still take up a lot of disk space. Deleted rows free space inside the database file without shrinking it.
Unpin runs when you’ve finished investigating. If you need longer retention, use a telemetry backend with a retention policy and backups.
What a historical run can tell you#
Historical runs are read-only. In last Tuesday’s run, you can’t restart a resource, run Load catalog, or change a parameter.
The dashboard starts watching the AppHost’s resources only when a page first needs them. A run that nobody opens in a browser can keep traces and structured logs but no resource snapshot.3 When there is a snapshot, it shows each resource as the dashboard last saw it.
Upgrades can strand old runs. The dashboard doesn’t migrate its schema. A Run database from an incompatible version stays in the selector but won’t open, and an incompatible Resume database is replaced. Before upgrading Aspire, save anything you still need from an old run.2
If you need to inspect or copy a database, include SQLite’s write-ahead log files, and don’t edit it with outside tools.
Under the hood: SQLite and Native AOT#
James Newton-King’s persistence deep dive explains the design. SQLite runs inside the dashboard process, with no database server to manage. Dapper queries filter, count, sort, and page telemetry in the database, so the dashboard doesn’t hold a run’s whole history as live .NET objects.4
In his large-telemetry test, private memory dropped from about 1,007 MB in Aspire 13.5 to 241 MB in 13.6. He measured each version once, after a forced garbage collection. Expect different numbers from this sample and from your own apps.
The 13.6 dashboard also ships as a Native AOT executable. His AOT write-up covers the work across Blazor, Fluent UI, serialization, and Dapper. For this workflow, the payoff is less startup and JIT work each time you stop and start the dashboard.5 Dapper.AOT ties the two changes together by generating query and mapping code at build time.4
Two caveats:
- The native dashboard doesn’t need a separately installed .NET runtime, but the Aspire CLI still makes sure one is available for the rest of Aspire.
- The dashboard’s experimental Blazor AOT work doesn’t make Native AOT a supported publishing option for Blazor Web Apps in general.
Protect what you keep#
Resource snapshots and telemetry can contain credentials, user data, and internal addresses. A value the dashboard masks on screen is still stored unredacted in the database.
The dashboard doesn’t add database authentication, encryption at rest, replication, or backups, so protect the data directory and any copies. Redact anything you share with a colleague, attach to an issue, or hand to an external tool.
For production retention and access control, use Application Insights or another telemetry backend built for that job.
Try this before the next refactor#
Stopping the app leaves dashboard history in place, so the pinned run is still there when you come back.
Next time you chase a bug, capture the failing request and pin its run before you change any code. After the fix, repeat the same request and compare the two traces. You’ll have something better to show in the review than “it worked after I restarted.”
Maddy Montaquila, Aspire 13.6: Your dashboard gets memory, September 29, 2026. ↩︎
Dashboard persistence modes, captured data, retention, compatibility, and security. ↩︎ ↩︎ ↩︎ ↩︎
The 13.6.1 dashboard’s
DashboardClientconnects to the AppHost’s resource service on first use, then watches resources for the dashboard’s lifetime. ↩︎James Newton-King, Adding persistence to the Aspire dashboard, October 8, 2026. ↩︎ ↩︎
James Newton-King, Bringing Native AOT to the Aspire dashboard, October 6, 2026. ↩︎